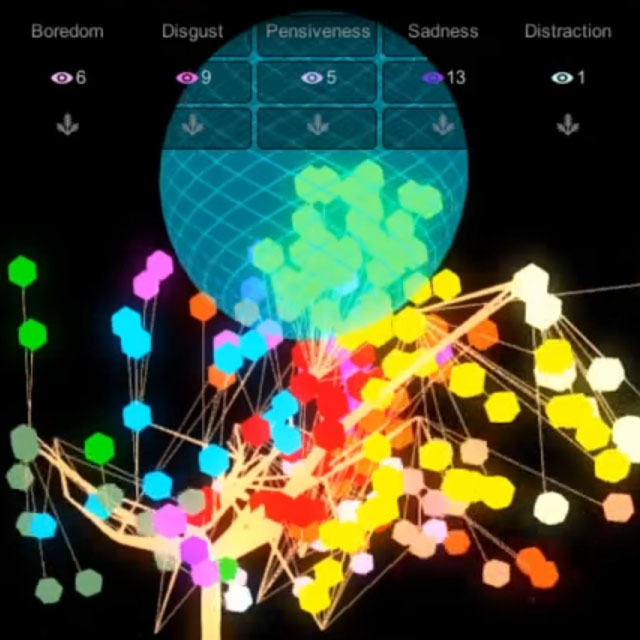
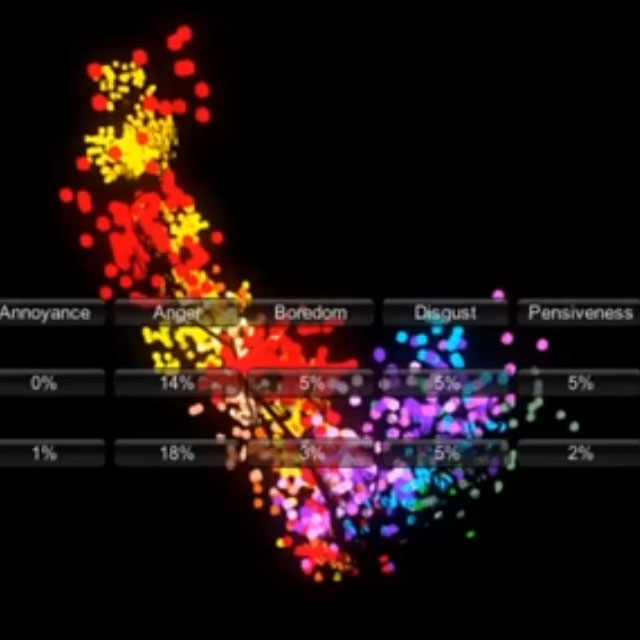
See the World's Conversations as a Living Forest
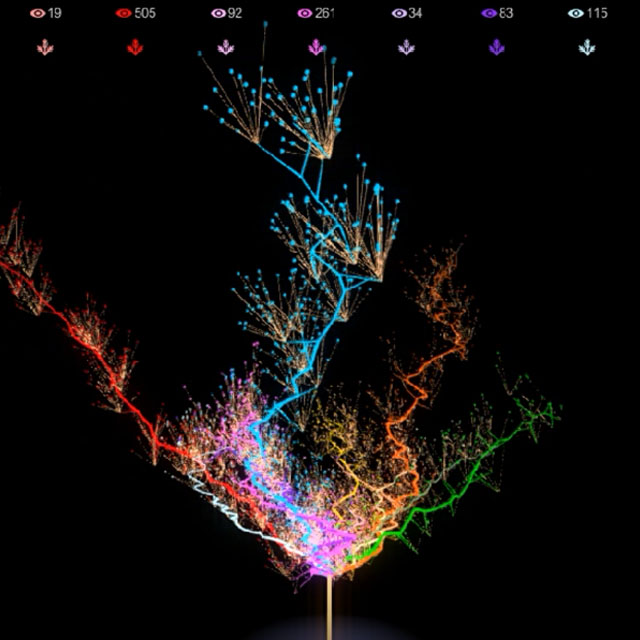
Big Forest transforms massive media data streams into stunning, interactive 3D tree visualisations — letting you discover patterns, hidden connections, and trends in real time.
See What You Don't Know You Don't Know
Traditional analytics shows you what you search for. Big Forest reveals what you didn't know to look for — the outliers, emerging clusters, and unseen patterns hidden within billions of data points.
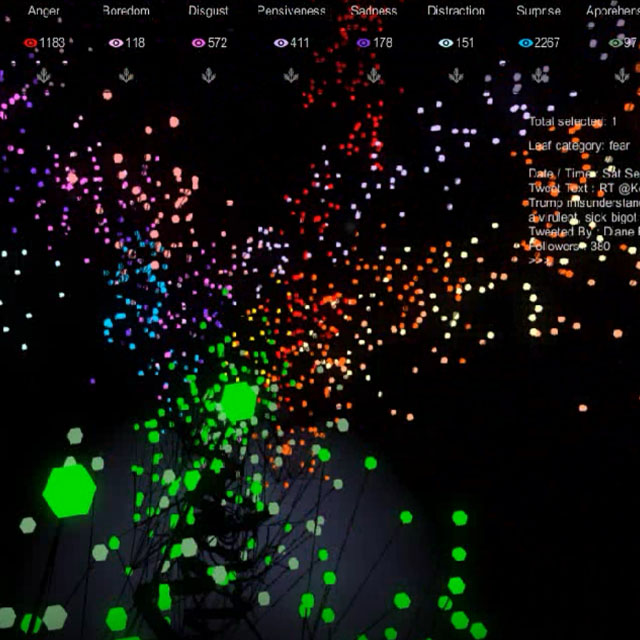
Our technology presents data as a growing, organic tree. Instead of scrolling through endless lists, you navigate a living data landscape in three dimensions.
- See outliers ignored by traditional search methods
- Predict emerging trends as they form in real time
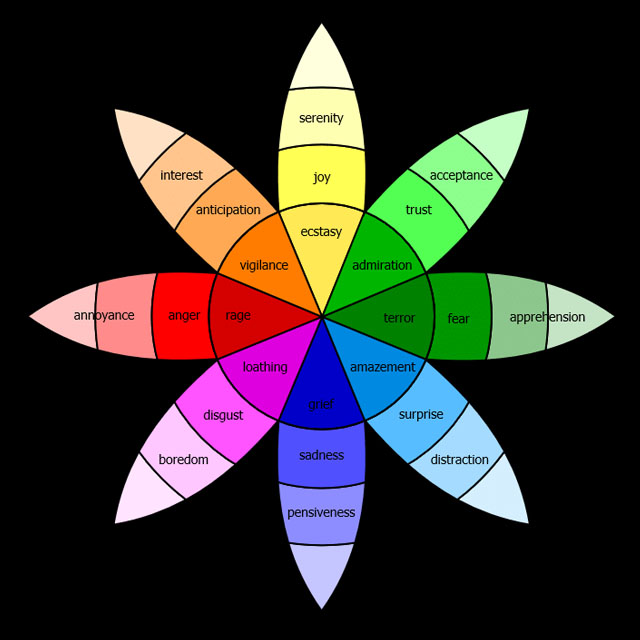
- Track how global sentiment evolves over time like a living organism
- Measure degrees of separation between any two entities
See It In Action
Watch the Big Forest Grow
Big Forest connects to social media and other sources and gathers comments according to the user's search term. Watch it build a living ecosystem of data in real time.
How It Works
Six Ways Big Forest Changes Everything
From real-time data streaming to immersive 3D exploration — our platform gives you capabilities no other tool offers.